Forecasting without Historical Data

We can forecast even when no historical data exists, if we use our experience and judgment. In Part 1 of our probabilistic forecasting series we looked at how uncertainty is presented; in Part 2 we looked at how uncertainty is calculated. Both of those parts presumed historical data was available.

TOTALLY MISSED [Converted].epsAlthough estimating without historical data makes many people uncomfortable, acting responsibly often requires us to do it. Fear of being wrong may cause us to avoid making any forecast at all, leaving someone else to make uniformed decisions. Forecasting helps us make better decisions by reducing uncertainty, even when there is little information. Probabilistic forecasting may involve experts expressing their guesses as a range. Wider value ranges in their “guesses” may indicate more uncertain inputs.

We recommend adopting these practices to get good estimates from experts:

  1. Estimate as a group to uncover risks that may expand the range of uncertainty (use Planning Poker or other anchor-bias reducing mechanisms to help expose differences).
  2. Estimate using a range, not a single value
  3. Coach experts to estimate using ranges to combat their particular biases towards optimistic and pessimistic

Range estimates must be wide enough that everyone in the group feels that the real value is within the range, as in “95 times out of 100 this task should take between 5 and 35 days.”

People can learn to be good estimators. Most people perform estimation poorly when faced with uncertainty (see “Risk Intelligence: How to Live with Uncertainty” by Dylan Evans and “How to Measure Anything” by Douglas Hubbard.) They found that practicing picking a range that most likely contains the actual value of known problems (wingspan of a Boeing 747, miles between New Your and London for example), then giving experts feedback on the actual answer, increased estimation accuracy. Practice helps resolve personal pessimistic and optimistic biases.

When estimating how long IT work will take, teams should provide a lower and upper-bound. When a project of sequential stories needs forecasting, it’s simple: the project forecast range is between the sum of the lower-bounds and the sum of the upper-bounds. However, few large projects involve completing stories strictly in sequence. If you have multiple teams, people working in parallel or complex dependencies, a simple sum doesn’t work (not to mention the unlikely luck of every pice of work being at the lower bound or the higher bound). Most projects need a more powerful technique for accurate forecasting.

Monte Carlo simulation can responsibly forecast complex projects, even if the only data you have is expert opinion. When Monte Carlo simulation is performed properly, we can propagate uncertainty accuracies from different components to create a responsible project forecast. For example, a statement like “We have an 85% chance of finishing on or before 7th August 2014” is mathematically supportable.

In next part of our probabilistic forecasting series, we will look at the likelihood of values within a range, how that can help narrow our forecast risk, and why work estimate ranges follow predictable patterns that help us be more certain.


Agile Metrics: Modern Management Methods 2014

We love supporting the community; especially in our home town. Come see us talk about agile metrics, risk reduction and cost of delay at the Modern Management Methods Conference in San Francisco May 5th to 8th. Troy Magennis and Dan Greening are both speaking on the Risk Management and Metrics track, click here for more details. Register for the main conference (Wednesday and Thursday) to attend our talks. Sign up for the 4-day option to attend our interactive tutorials.

Get 15% off conference registration by using the discount code LKSPEAK when registering through the website.

Risk-Reduction Metrics for Agile Organizations
Dr. Dan Greening
Wednesday, May 7 • 2:20pm – 3:00pm

Agile and lean processes make it easier for organizations to measure company and team performance, assess risk and opportunity, and adapt. My colleagues and I have used delivery rate, concept-to-cash lead-time, architectural foresight, specialist dependency, forecast horizon and experiment invalidation rate to identify risk, and focus risk-reduction and learning efforts. With greater knowledge, we can eliminate low-opportunity options early and more deeply explore higher-opportunity options to maximize value. We’ve used these metrics to diagnose agility problems in teams and organizations, to motivate groups to improve, to assess coaching contributions, and to decide where to spend coaching resources. We face many problems in using measurement and feedback to drive change. Manager misuse or misunderstanding of metrics can lead organizations to get worse. Teams or people that mistrust or misunderstand managers often game metrics. And yet, what we can’t measure, we can’t manage. So part of a successful metrics program must involve creating and sustaining a collaborative, trusting and trustworthy culture.

Understanding Risk, Impediments and Dependency Impact:
Applying Cost of Delay and Real Options in Uncertain Environments
Troy Magennis
Wednesday, May 7 • 4:20pm – 5:00pm

Many teams spend considerable time designing and estimating the effort involved in developing features but relatively little understanding what can delay or invalidate their plans. This session outlines a way to model and visualize the impact of delays and risks in a way that leads to good mitigation decisions. Understanding what risks and events are causing the most impact is the first step for identifying what mitigation efforts give the biggest bang for the buck. Its not until we put a dollar value on a risk or dependency delay that action is taken with vigor.

Most people have heard of Cost of Delay and Real Option theory but struggle to apply them in risky and uncertain portfolios of software projects. This session offers some easy approaches to incorporate uncertainty, technical risk and market risks into software portfolio planning in order to maximize value delivered under different risk tolerance profiles.

Topics explored include

  • how to get teams to identify and estimate impact of risks and delays
  • how to identify risk and delays in historical data to determine impact and priority to resolve
  • how risks and delays compound and impact delivery forecasts, and what this means to forecasting staff and delivery dates
  • how to calculate and extend Cost of Delay prioritization of portfolio items considering risk and possible delays
  • how Real Options can be applied to portfolio planning of risky software projects and how this can change the bottom line profitability

Capturing and Analyzing “Clean” Cycle Time, Lead Time and Throughput Metrics
Troy Magennis
Thursday, May 8 • 11:00am – 12:30pm

On the surface, capturing cycle time and throughput metrics seems easy in a Kanban system or tool. For accurate forecasting and decision-making using this data, we better be sure it is captured accurately and free of contaminated samples. For example, the cycle time or throughput rate for a project team working nights and weekends may not be the best data for forecasting the next project. Another choice we have to make is how we handle large and small outlier samples (extreme high or low). These extreme values may influence a forecast in a positive or negative direction, but which way?

This interactive session will look for the factors attendees have seen that impair data sample integrity and look for ways to identify, minimize and compensate for these errors. The outcome for this session is to understand the major contaminants and to build better intuition and techniques so we have high confidence in our historical data.

We’re really looking forward to this conference and hope to see you there!
— Troy and Dan

Probabilistic Forecasting

In Part 1 of this series we discussed how probabilistic forecasting retains each estimate’s uncertainty throughout the forecast. We looked at how weather forecaster’s present uncertainty in their predictions and how people seem comfortable that the future cannot be predicted perfectly and life still continues. We need this realization in IT forecasts!

In Part 2 we look at the approach taken in the field of probabilistic forecasting, continuing our weather prediction analogy.

We can observe the present with certainty. Meteorologists have been recording various input measure for years, and evidence suggests ancient cultures have understood the seasons to the extent they knew what food items to plant and when. These observations and how they played out over time form the basis for tomorrow’s weather forecast. Modern forecasters combine today’s actual weather conditions with historical observations and trends, using computer models. Continue reading

Forecasting Defined

This is the first article in a series that will introduce alternative ways to forecast date, cost and staff needs for software projects. It is not a religious journey; we plan to discuss estimation and forecasting like adults and understand how and when different techniques are appropriate given context.

Stakeholders often ask engineers to estimate the work for a project or feature. Engineers then arrive at a number of story points or a date and  present the result as a single number. They rarely share uncertainty or risk with those estimates. Stakeholders, happy to get “one number”, then characterize engineer estimates as commitments, and make confident plans that depend on achieving the estimate. Problems arise when uncertainty and risks start unfolding and dates shift. Failure to communicate engineering uncertainty is a key difference between estimation and forecasting. Continue reading

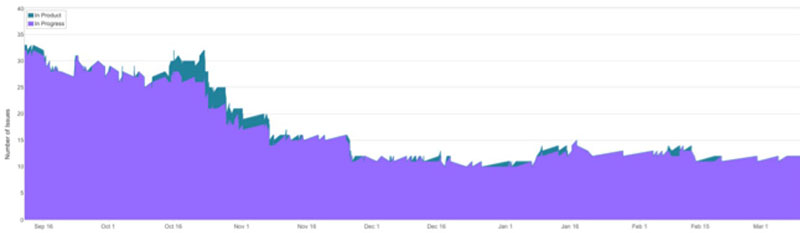
Breaking into Quality: Prioritization as a Pitfall

Our team kept solving the easy stuff, the big deliverables seemed to take forever, and would inevitably come out with major bugs.  Do the right things right… Why not just do that?  For any one product, a number of people and processes come together.  We automatically operated by priority, and this turned out to be the central problem.  The chart below shows a 66% reduction in our severe bug rate since then.

Severe Bugs: Quality (priority 1-2)

Severe Bugs: Quality (priority 1-2)

It seemed to be the right thing: when a customer reports a bug of high priority, jump on it.  When a server crashes,  jump on it.  When the senior person finds a critical bug,  jump on it.

In our meetings, the teams decided that instead of “Priority” being our call to action, we should “order” our work, always consuming our backlog from first to last.  Yet, we kept jumping on it. Continue reading